Search for the floor cleaning equipment market and you will find a shelf of numbers that disagree with each other — different totals, different growth rates, different definitions of what counts as equipment. Most of the disagreement is not error. It comes from treating one phrase as one market. In practice, machines sold to contract cleaners, hospitals, warehouses and municipalities move through different buyers, on different cycles, over different trade routes, at different price points. This guide explains that structure, and how to read public data on it without being misled.

QUICK ANSWER
The floor cleaning equipment market is not one market — it is four demand structures running at once, and the quoted totals rarely say which one they describe.
- Buyers decide volume, not products: contract cleaners buy on labor substitution, facilities on replacement cycles, projects through tenders, rental fleets on residual value.
- Replacement outruns new construction: an installed base turns over on a predictable rhythm, and battery life now resets that rhythm mid-cycle.
- Trade statistics are the most honest public source — if you read them correctly. UN Comtrade reports value and quantity by customs code; unit values reveal positioning, but re-exports and mixed classifications distort the picture.
- Any market size deserves suspicion until its definition is stated — machines only or plus service, factory shipments or retail sales.
The sections below cover buyer segments, replacement cycles, regional trade flows, the battery shift, channel structure and the traps inside public statistics.
Why “The Market” Is a Misleading Phrase
There is no single floor cleaning equipment market to measure — there are parallel demand structures that happen to share a product category.
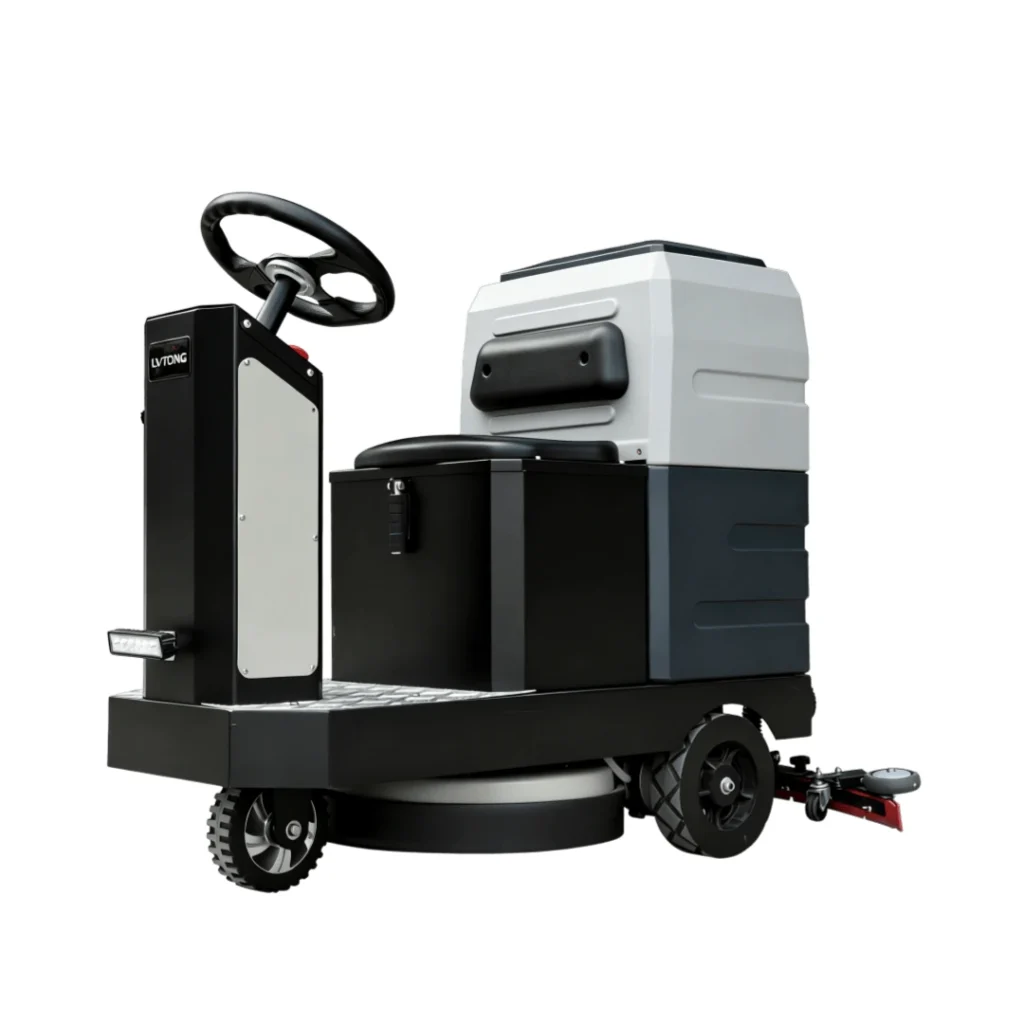
A ride-on scrubber sold to a contract cleaning company and an identical machine sold to a hospital procurement department are the same product and different purchases. The contractor is buying capacity it can bill for; the hospital is buying compliance it can document; the distributor is buying a margin and a warranty; the tender is buying a specification. Each purchase responds to a different trigger, budget cycle and approval chain, so each behaves like its own small market. That is why a headline figure covering “the market” can be accurate and useless at the same time: it sums segments that do not move together, and hides the one you actually sell into.
Who Buys: Four Demand Structures and Their Triggers
Ask who buys floor scrubbers before asking how big the market is — the buyer type tells you the trigger, the cycle and the specification.
| Buyer type | What triggers the purchase | What they ask first |
|---|---|---|
| Contract cleaning companies | Winning or renewing a contract; labor cost per square meter | Utilization per shift, reliability, service network |
| In-house facility teams | Replacement cycle, downtime, new site opening | Fit to existing fleet, spare parts, training |
| Project and tender buyers | Capex approval and tender calendar | Specification compliance and documentation |
| Rental and leasing fleets | Fleet rotation and residual value | Resale value, durability, fast repair turnaround |
The commercial floor cleaning equipment market is often quoted as a single figure, but these four buyers rarely peak at the same time. Contract renewals cluster around calendar cycles; tender-driven demand follows public budgets; fleet rotation follows depreciation schedules. A supplier seeing flat demand from one buyer type may still be missing growth in another.
Replacement Cycles Set Most of the Volume
New sites add incrementally; the installed base is what moves the floor scrubber market — and battery life now resets that clock mid-cycle.
Capital equipment sells twice: once when a site opens, and again every time the machine in it wears out. For scrubbers, the second sale usually dominates, because the installed base is large relative to annual additions. Typical replacement windows in this category run five to eight years for the chassis, with batteries, squeegees and brushes replaced more often — treat those ranges as planning assumptions to confirm against your own fleet records, not as fixed rules. The commercial consequence is that a market can look flat in new-site terms while staying busy in replacement terms, and vice versa. Distributors who track installed-base age by account forecast better than those who watch construction starts.
Where Demand Runs: Reading Regions Through Trade Flows
Region-by-region growth claims are hard to verify; traded value and volume by customs code are not — start from flows, not from forecasts.
Most published regional splits arrive without a reproducible method behind them. Public trade data does have one, and trade promotion agencies such as the International Trade Administration publish country guides that frame the demand context. UN Comtrade publishes annual and monthly import and export records by reporting country and commodity code, which lets you see which markets are net importers, how values moved across years, and what average unit value each lane carries. Read as lanes rather than rankings, three patterns usually appear in this category: intra-regional trade between neighbouring industrial economies, import concentration in markets without domestic machine manufacturing, and project-driven spikes that do not persist. None of these require a forecast to be useful — they only require knowing which lane you sell into.
The Battery Shift and What It Does to Demand
Lithium power is a demand-structure change, not just a product upgrade: it shortens the payback, raises utilization and pulls replacement forward.
When machines move from lead-acid to lithium, three commercial things change. Charging windows shrink, so a contractor can run the same machine across more of the day — utilization rises, and the case for buying a second machine weakens. Battery lifetime starts to govern resale value, which matters to rental fleets. And the total cost calculation shifts from “cheap machine plus frequent battery replacement” to “higher purchase price, lower running cost,” which changes what a buyer will accept on the invoice. The technology itself — chemistry, charging profiles, connected fleet data — is covered in the commercial floor cleaning technology trends guide; the market point here is simpler. A fleet that upgrades to lithium does not buy fewer machines forever, it buys them on a different rhythm.
Channel Structure: Who Moves the Machines
Machines reach floors through four channel types, and margin sits in different places in each — a structure worth understanding before negotiating.
Factory-direct export suits large tenders and private-label volumes; regional distributors carry stock, service and local credit; rental fleets monetize uptime instead of units; online B2B listings move small machines and spare demand. Across the commercial floor cleaning equipment market, one rule holds in every channel: whoever holds service capacity holds the customer. A distributor without technicians becomes a box mover the moment a warranty claim arrives. The economics of partnering — territory terms, exclusivity, margin structure — belong to the partnership discussion rather than this guide, and the distributor partnership programme sets out how LVTONG structures that conversation.
How to Read Trade Statistics Without Fooling Yourself
Customs data answers real questions, but only after you check three things: the code, the unit value and the re-export trail.
| Signal | What it means | The trap |
|---|---|---|
| Rising import value, flat quantity | Mix is shifting up — bigger or battery-equipped machines | Currency effects can produce this without any mix change |
| High average unit value | Premium positioning or small, specialized machines | Accessories and parts bundled into the same line inflate it |
| One market spiking | A tender or a single project landed | It rarely repeats next year; do not treat it as a trend |
| Sudden drop in a lane | Re-routing through a neighbouring hub | Re-exports make the same machine appear twice |
Classification is the first thing to verify. Floor machines are assigned to customs codes that depend on configuration and on each country’s tariff schedule, and the World Customs Organization administers the Harmonized System those schedules are built from. Ask a customs broker which subheading applies to your product in your market before comparing floor scrubber import statistics across countries — two neighbours can report the same shipment under different codes, and national import rules sit with customs authorities such as U.S. Customs and Border Protection. A paid floor cleaning equipment market report can be a useful starting point, but check whether its definition matches yours: machines only, or machines plus service; factory shipments, or retail sell-through.
What the Numbers Do Not Tell You
Every published figure understates or overstates something — installed base, refurbished units and informal imports are the three biggest blind spots.
Installed base is the number that decides replacement demand, and no trade statistic reports it; you can only approximate it from historical import volumes minus assumed retirement. Refurbished and locally rebuilt machines circulate in most price-sensitive markets and never appear in new-machine statistics. Informal cross-border trade disappears from customs records entirely. Tender-driven demand arrives in lumps that annual totals smooth away, which is why a specification-driven purchase deserves its own method — the tender specification guide covers that path separately. None of this makes trade data unreliable. It makes a single number insufficient.
Using Market Data to Make a Buying or Selling Decision
Market data is only worth the decisions it changes: use it to size a lane, choose a machine class and set a replacement policy — not to decorate a slide.
For a distributor, the practical sequence is: identify the demand structure you sell into, size the floor scrubber market from trade records rather than from reports, then choose the machine classes that fit it. A market dominated by contract cleaners rewards reliability and service depth; a market dominated by project buyers rewards documentation and specification compliance. For a facility, the same data becomes a replacement policy: track the age of the fleet against the cycle you actually observe, and budget replacements before downtime forces them. Comparing countries of different income levels needs a denominator, and World Bank open data supplies population, GDP and services share. The machine-level version of that decision — matching classes to floor types and shifts — is set out in the floor scrubber selection guide, and the range itself sits in the floor scrubber and sweeper range.
Conclusion
The industrial floor cleaning equipment market rewards readers who refuse to compare numbers built on different definitions. Segment the buyers, respect the replacement cycle, read trade lanes instead of forecasts, and verify codes before comparing countries. If you are sizing a market for a business case, send us the region, the buyer type and the machine class you are planning around, and talk to our export team — we will share what we see from the shipment side, and separate what is measured from what is assumed.
Frequently Asked Questions About the Floor Cleaning Equipment Market
What drives demand in the floor cleaning equipment market?
Three forces dominate: labor cost and availability in service-heavy markets, replacement of an aging installed base, and project or tender cycles in public and institutional buyers. New facility construction contributes less than replacement in most mature markets.
How large is the floor cleaning equipment market?
There is no single defensible figure, because published totals use different definitions — machines only or machines plus service, factory shipments or retail sales, one region or global. Use trade records for volumes and a clearly stated definition for any number you quote.
Which countries import the most floor scrubbers?
It changes yearly with project timing and currency, and comparisons break when countries classify machines under different customs codes. Check UN Comtrade for the reporting years you need, confirm the code with a broker, and treat single-year spikes as events rather than trends.
Is demand shifting from corded to battery machines?
Directionally yes: lithium power shortens charging windows and raises utilization, which suits contract cleaners. The pace differs by market and by price segment, so verify it in the trade data for the lane you sell into rather than assuming a global rate.